Thursday, April 18, 2013

Madrid Public Transport


Last week I attended MetroRail 2013, a conference of rail-oriented urban transportation providers from around the world (except from the US). Hosted in Madrid, Spain, the conference included many presenters from Europe and Latin America, with some representation from southern Asia, South Africa, and Canada. I approached the conference as someone from a third-world country might, knowing how far we have to go in Michigan, but determined to learn what I could about the economics and system organization of those who have more experience than we do.

Of course, much of the emphasis was on problems we don't have - particularly, how to expand capacity of existing metro rail lines that have been saturated and overcrowded. (In case you're curious, the leading strategy for managing this is Communications-Based Train Control, CBTC, but that's not a problem we need to address in Michigan yet!)

Madrid Area Stats

Since Madrid was the host city, I'd like to give you a brief look at its public transport system in comparison with what we're more familiar with in the States. My main source of information is a talk presented by Carlos Cristóbal-Pinto, Director of Quality, Processes and External Affairs of the Consorcio Regional de Transportes de Madrid (CRTM), the Regional Transport Consortium of Madrid. I believe this is a fairly close organizational equivalent to the Detroit area's Regional Transit Authority (RTA).

I've pulled together some figures to compare the Madrid and Detroit areas. I've included the Southeast Michigan RTA area, since I'm focusing on transportation here; and the Dallas-Fort Worth Metropolitan Statistical Area (MSA), since it's the closest US metro in population to Madrid.
City
Pop
Area (SqMi)
Density
Madrid city 3,250,000 232 14,009
Madrid Metro
6,489,680
3097
2,095
Detroit city 706,585 143 4,946
RTA Area (4-county) 5,563,643 6,537 851
Dallas MSA 6,700,991 9,286 722
Notice that the city of Detroit is more than twice as densely populated as the Madrid metro area as a whole - even after Detroit's loss of population during the last few decades. Also, the RTA area is only 41% as dense as the Madrid metro area (which is the same as their Regional Transport Consortium's area).

The Madrid metro area is made up of 179 municipalities, with almost 6.5 million inhabitants in an area of 3100 square miles. In population, it's a bit bigger than the Southeast Michigan metro area - about the population of the Dallas-Fort Worth metro area, though only about ⅓ its area. About half of Madrid's population lives in the City of Madrid proper, which has an area of 232 square miles. Compared with the city of Detroit, the city of Madrid is almost twice as large in area, but with five times the number of people. Private houses are rare in the city of Madrid; most people appear to live in apartment buildings eight or ten stories tall.

Madrid's "RTA"

Madrid's CRTM was established in 1985; our RTA held its first Board meeting a few days ago, April 9, 2013. I'm not familiar with the legal framework for transit authorities under Spain's constitution and laws, but we can piece together some inferences based on what I heard and read. In Spain the government appears to have jurisdiction over transit in much the same way that the U.S. government has jurisdiction over roads. That is, if you want to build a road here, you need permission from the government unless it's all on your property; if you want to provide public transportation in Spain, you need permission from the government. Here, if a company (for example, Indian Trails) wants to run bus service, they need to get a Common Carrier license from the state in which they operate - or, if they operate between states (like Megabus) from the Federal government. Once a license is obtained, the company can operate pretty much as it chooses, as long as safety rules are observed.

In Spain, metropolitan area transit is controlled more closely by the authorized agency, and private companies wishing to run urban transit (like the M1 Rail consortium in Detroit) must go one step further and contract with their equivalent of the RTA. The Authority has broad powers to determine the terms of the contract and how the service will be operated. Later in this post, we'll look in more detail at one of the contractors.

Among the 179 municipalities that make up the Madrid metro area, several have their own transit agencies, or contract with private companies to provide it.
  • Metro Madrid is owned by the Region (I suppose through the CRTM) and runs the subway system, providing 2.2 million rides per day. 
  • EMT is owned by the city, rather like DDOT, and runs buses that carry 1.4 million passengers per day. 
  • In 38 outlying municipalities, buses are provided by three public agencies (rather like SMART and AATA), plus 8 private companies that operate as concessions directly under the CRTM. 
  • But there are also 21 private bus companies that provide regional service under 31 different concessions. This is a little like Indian Trails providing regional service with support from MDOT; more like Indian Trails operating AirRide under contract with AATA. 
  • With all these buses running between cities in the region and nationally, CRTM has contracted with private companies to operate five intermodal bus terminals roughly in a ring around the core of the city.
  • Commuter and national rail services are provided by RENFE, the Spanish equivalent of Amtrak. 
  • Finally, four light rail lines have been built recently. Two of these are run by one private company; we'll look at this in more detail in a moment. One is run by another private company, and the fourth is run by Metro Madrid, the subway company.
As you can see, this urban region is served by lots of different modes of transit, and these are provided in several different ways. Some are directly owned by the "RTA", others are owned by municipalities, and still other are privately financed and operated.

Mode Share

Given the density of Madrid, it's not surprising that 63% of trips in the city were by public transportation, while only 37% were by private vehicle. (Data is from 2004, the figures presented by Sr. Cristóbal-Pinto.) Of the 15.2 million daily trips in the region that year, there was a pretty even split between modes, as shown in this chart:
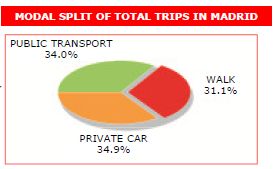
Modal split of total trips in Madrid
(Carlos Cristóbal-Pinto)
It's interesting that somewhat more trips within the city were by private car, fewer within the region. Perhaps the congestion on expressways explains that, at least in part. The region has a well-developed system of limited access and trunk roads, easily comparable to Detroit's in quantity, quality...and congestion.
Madrid metro area showing expressways (in yellow)
(Google Maps)

Investment and Ridership

Madrid's first subway was opened in 1919 by a private company, and expanded slowly during the following decades. A much more vigorous expansion took place in the1970s to help serve the rapidly expanding population of the area and combat urban sprawl. Unfortunately, by the late 70s the company's project management deteriorated, and work ground to a halt until the 1990s. At that time, the CRTM, which had been formed a few years earlier, purchased the Metro company, took over operations, and resumed expansion.

Since then, Madrid has invested heavily in transportation, both highway and public. Of course, the ups and downs of the economy have caused acceleration and deceleration of progress; Spain is currently in an economic down phase, but even so, investment continues - though more slowly.

The primary public investment has been in rail, which makes sense given the need to move lots of people through a densely populated area. In length, Madrid's Metro is now the sixth-longest in the world, though it's only the fiftieth city by population. The majority of rail investment has been in subways, followed by commuter rail and light rail. Here's a breakdown - not of investment but of ridership (passengers per day):
  • Subways: 2,200,000
  • Madrid city buses: 1,400,000
  • Intercity buses (through intermodal terminals): 900,000
  • Commuter rail: 800,000
  • Regional buses: 700,000
  • City buses other than Madrid: 150,000
  • Light rail: 50,000

Madrid metro area urban rail lines (not including commuter)
(Metro de Madrid, S.A.)

What's it Like?

My own experience of the public transport system includes commuter rail (the airport line), light rail (one short ride with a tech-tour group), and primarily subway. None of the modes seem to stress speed - the commuter rail was relatively slow, but comfortable; the subways were also slow relative to other systems I've been on, but quite frequent (every 3-6 minutes most of the day, every 10 between about 8 PM and 1 AM).
As to speed, the line I rode most often (Line 5) took me downtown in about half an hour. The distance is about 9 miles, and there are 16 stops. That's about 1.8 stops per mile, an average speed of about 18 MPH. Anywhere near the city center, the train was always standing-room only.

Superficial demographics: Madrid subway riders included people of all ages and most socioeconomic levels (except perhaps the very highest). One thing that impressed me was that almost everyone was trim and reasonably fit, though of course many appeared tired at the end of the day. At least half were reading or using electronic devices - whether seated or standing. Racial diversity was evident: the majority of Spanish people are European in appearance, with a high percentage of light-skinned people and quite a few blond-haired with light (green or grey) eyes. (Most of the blonds were women, which may require us to discount the numbers somewhat...)
The darker-skinned people were primarily native-American in appearance, and I got the impression that many were employed in the more menial jobs. It is relatively easy for Latin Americans to work in Spain since they know the language, though I don't expect immigration is much encouraged. There was a smattering of Asians, Mediterraneans, and Africans. And of course some of these were tourists or international students, though the majority of tourists probably stay above-ground. (It takes a real transit-nerd like me to plunge under a city into crowded trains running on complex routes...)

Madrid's BRT

Madrid has a single bus rapid transit (BRT) line on the west side of the city. It's a ten-mile line running through an area of relatively un-dense, affluent population, built during the period 1991-1995. This video on YouTube refers to it; more information has been difficult to find.

Concessions

As I mentioned, many of the lines are run by private companies with concessions from the city. This is a type of PPP that seems to work well in Madrid. I've gotten materials from one such operation: the Metro Ligero Oeste (Light Metro West) during a visit to their operations center at Cocheras on the Colonia Jardín to Bobadilla light rail line.

In order to win the concession, a company, "Metro Ligero Oeste" (MLO), was formed whose stockholders are an investment bank - Ahorro Corporación (30%), with two concession operating firms - COMSA EMTE Conceciones (18.70%) and OHL (51.3%). The majority partner, OHL, is a diversified Spanish company with operations in several countries involving development, construction, and operation of a port, an airport, toll roads, and this light rail line.

Here's how it works: the CRTM gave MLO a 30 year finance+build+operate contract in 2006. (It wasn't clear whether they were responsible for design and engineering.) MLO then invested about €650 million - just shy of $1 billion US - to build the track, stations, maintenance depot, and a small state-of-the-art control center. They also purchased a fleet of Alstom Citadis 302 light rail vehicles, and began operations in 2007 over 13.8 route-miles with a staff of 180. They do not receive fares directly; rather, fares are collected by the CRTM, and MLO receives a per-passenger-trip amount from CRTM. The expectation of the MLO partner companies is that they will recoup their capital and operating expenditures at some point before the end of the contract. CRTM, on the other hand, has authorized the establishment of a public transportation line with little or no cost to itself (depending on whether it did the initial studies and engineering), and apparently no risk.

What a deal for the transit authority! This type of arrangement wouldn't be possible in Southeast Michigan, or in any of the US, because there is no track-record whatever of public transportation making a profit. Apparently the situation is different in Spain. It's not that the fares are significantly higher: the base fare for an adult traveling in one zone is €1.50, roughly $2.00 US. Other factors include the high cost of motor fuels and the greater population density - though the area where the light rail operates is not a particularly dense one. It remains to be seen whether MLO will make a profit, break even, or fail. An interesting experiment, and I wish them well.

So...

Madrid and Southeast Michigan have about the same population, but we have a lot lower density. Naturally, that makes public transportation more expensive to build and operate.

But there's a reason for our lower density: lack of public transportation. That's a fine "catch-22", right?

Low density is a problem. It will become increasingly expensive to maintain any kind of transportation in the coming decades if we don't start now to build good, sustainable transit systems. Cars will get more expensive even if fuel costs stay level or decrease; auto insurance - especially medical - will increase. If "automated roads" are developed and built, the cost of construction and maintenance of roadways will get much more
expensive.

But if we build good transit, density will start to increase. This has been shown time and again in American cities. And higher density lowers the cost of providing transit systems.

Building good transit now is a WIN for Southeast Michigan. Let's do it.

To learn more:
  • A little about Dallas-area rail transit (this blog)
  • Wikipedia has up-to-date, accessible statistics about cities: Detroit, Dallas, and Madrid
  • Dallas Area Rapid Transit (DART)
  • Madrid Transport Consortium (CRTM)
    (Unfortunately, Carlos Cristóbal-Pinto's power-point is available only to conference attendees) 
  • Madrid Metro history

Sunday, March 17, 2013

SE Michigan Commuter Rail Updates


At the Ann Arbor Transportation Authority's Planning and Development Committee this week, we got updates from Michael Benham on the two commuter rail projects in southeast Michigan.

WALLY

AATA is administering a grant to develop the stations along the WALLY route from Howell to Ann Arbor. Although generic stations were outlined in the initial engineering study, each station needs to be customized for its actual location, and some locations haven't actually been determined in some cases.
The first station to be focused on will be the downtown Ann Arbor station. Of course, that depends on negotiations with Watco, the new owners of the Ann Arbor Railroad, and we learned that discussions are now beginning with the Watco managers.

ANNDE

ANNDE is my name - to match WALLY - for the Ann Arbor - Detroit commuter line. (Hope you like it!) For several years now, there's been a desire to have demonstration trains; the first was to have connected the Toronto hockey fans coming to Michigan Stadium to see the Maple Leafs be defeated by the Detroit Redwings (well, that was the Michigan perspective!). Whether it would have worked if the hockey season hadn't been canceled is a moot point. Naturally, baseball season seemed like the next opportunity to bring people to a game by train, but SEMCOG folks are now saying they think the next Hockey season will be the first realistic opportunity to show off the MiTrain setup in action.
Meanwhile, there's still the possibility of letting people get in the cars and see how nice they are. (I had a chance to do that a year ago!) "Static displays" (the official expression) are being planned, and one place being mentioned for that is the Ypsilanti Freight House siding. This Grandpa will definitely try to take his grandkids if that happens!
Of course a train needs track to run on. In theory, ANNDE has the track it needs; in practice, it would be difficult to schedule five trains each way every day because, for most of the distance, there's only one track. Fortunately, federal grants for high-speed rail are allocated and - I believe - obligated for restoring double-track to the stretch from Dearborn to just east of Ypsilanti. That will make the desired schedules feasible, and we learned that work is to begin this summer. It's expected to take a couple of years to finish the project, so we're not likely to see commuter service before that.

Slow but steady

Both of these projects seem to be moving quite slowly, but in fact they're going about as fast as most such efforts. Typically commuter rail projects in the U.S. have taken about ten years from the first official proposal to the first revenue service. Both WALLY and ANNDE were proposed in 2006, so at seven years into the process, we actually have a fair amount to show. Of course, funding operations is still a bridge marked "to be crossed later". We can't expect much in federal operating funds, so we must be prepared to push for state and local funding.

Wednesday, March 6, 2013

Amtrak Route Performance: Right Numbers, Wrong Analysis


A few days ago, the Brookings Institution released a report entitled, "A New Alignment: Strengthening America's Commitment to Passenger Rail", by Robert Puentes, Adie Tomer, and Joseph Kane. It crunches the numbers on ridership and cost for all of Amtrak's routes.

Many of my friends in the passenger rail support community are deeply disappointed and even angry about this report. "It savages long-distance routes," says Dr. Bill Pollard, President of the Texas Eagle Marketing and Performance Organization (TEMPO), which has very effectively supported its namesake long-distance route for at least 25 years. The National Association of Railroad Passengers (NARP) was somewhat more measured in expressing its disappointment, giving Brookings the thumbs-up on some of its points, and thumbs-down on others.

The report focuses on financial aspects, and certainly most of the criticism in Congress and elsewhere has taken that approach. But the report points out as well that other modes of travel are also subsidized by Federal and state funds, and the financial benefit of transportation - especially passenger rail - needs to be considered much more broadly. And they did not fail to mention that Amtrak's long-distance routes provide service to parts of rural America that have been abandoned by both air and bus lines.

Now, I respect the Brookings Institution and its scholarly approach to issues of national importance. Puentes, Tomer and Kane did a good job of gathering the numbers, and many of their conclusions make a lot of sense. I sincerely doubt they were trying to "savage" the long-distance routes, but chose comparative metrics that don't tell the full story of long vs. shorter routes.

One of their main recommendations is to get the states that want long-distance routes involved in supporting them financially - a recommendation that seems to make sense, as we'll see later in this post.

Not so fast!

Puentes and his colleagues may have looked at a lot of numbers, but not always in the right way. They divided Amtrak routes into two categories: those up to 400 miles, and those longer than 400. Although that makes a lot of sense superficially, it ignores underlying factors which have much more to do with cost and ridership than just the length of the routes. The factors of real importance to determining a route's success are travel time, frequency, and reliability.

Each of these three factors happen to align fairly well with route length, and it's very easy to run correlations between miles and dollars. But it's a big mistake to stop there. Each long-distance route has longer travel time, at most one train a day, and mediocre to poor on-time performance.
Acela trainsets being serviced at Sunnyside Yard, Queens, New York
Here's a good illustration: As we all know, the route that gives Amtrak its best financial return is the Northeast Corridor (NEC). It also provides the shortest downtown-to-downtown travel time compared to auto, bus and air; the greatest frequency of service; and very good on-time performance (85% overall). To be fair, the Brookings report mentions each of these factors; it just doesn't extend them into its conclusions about long-distance routes. But the Northeast Corridor is actually 453 miles from Boston to Washington. An Acela Express leaving at 5 AM arrives in Washington at 11:47, 6 hours 37 minutes after leaving Boston - an average of 68.5 MPH including station-stops. These Acela trains charge premium prices, yet are heavily patronized; there are ten Boston to Washington Acelas each weekday, and they were on time 92% of the time in 2012.

Brookings contrasts these with long-distance routes: "Every single one of the eighteen corridors traveling longer than 400 miles operated at a negative operating balance in 2011, whether traveling just over 400 miles on the Pennsylvanian or clear across the country on the California Zephyr". Now, the Pennsylvanian travels a distance of 444 miles, actually less than the distance from Boston to Washington. But it takes 9¼ hours get from New York to Pittsburgh - an average of 48 MPH - and there is only one daily train each way, though like the Acelas it was on time 92% of the time in 2012.

I'd be more than willing to let Puentes off the hook for treating the NEC as less than 400 miles - it is close - had he not pointed to the Pennsylvanian as losing money for being over 400 miles, when its route is shorter than that of the Acelas. That's pretty sloppy. So let's look at each of the factors I believe are truly important, and illustrate them with cases that show their impact.

Travel time

The distance measure of 400 miles is arbitrary, but it does correlate to a fairly steep drop-off in ridership on many routes. But as I just pointed out, route-miles are not as important as travel time. Rather than base conclusions on the route-length of a train, our conclusions should be based on the travel time, particularly in comparison with other travel options.

This is important - not just an academic distinction. When we use time rather than distance, we come up with entirely different solutions to problems. Not much can be done inexpensively to shorten the rail-distance between two destinations, but several things can be done about the time. For example, shortening or eliminating en-route delays, both at stations and at sidings; using rolling-stock that can negotiate a route without slowing down so much at curves; building relatively short segments of track (say, between one and ten miles) that enable passenger trains to enter and leave cities more directly and with less delay. Another tactic is to add a second station track and platform at certain locations where passenger trains either block one another or impede freight movements on host railways. These are strategic investments that are not as glamorous as increasing the top speed on tracks in open country, but could cut significant time from many routes.

Case in point: West Detroit Junction. This one choke-point is responsible for ten minutes' delay between Detroit and Dearborn, Michigan. The distance is only 9 miles, but the current schedule has to allow 27 minutes between these two stations - an average speed of 20 MPH, unacceptably slow. By adding a pair of switches and a short connecting track (work is about to begin on this), trains are expected to take only 17 minutes, an improvement of 37% without changing speed limits or buying new, faster trains. Six Amtrak Wolverine trains make this run every day on their way between Pontiac Michigan and Chicago, 365 days a year. This seemingly small savings - ten minutes - adds up to 60 minutes each day, or 365 hours each year.
Another case: The Brookings report compares the Hoosier State with the Hiawatha service between Chicago and Milwaukee:
However, not every short-distance corridor benefits from such large metropolitan anchors. The Hoosier State runs between Chicago and Indianapolis, a similarly-sized anchor to Milwaukee on the Hiawatha. At double the distance and only one daily departure the Hoosier State's 2012 ridership (37,249) was just four percent of the Hiawatha's (819,493). Partly as a result, the Hoosier State lost over $100 per rider in 2012.
The Hiawatha service runs on straight, high-speed track. With three intermediate station-stops, it completes its 86 mile run in one hour thirty-seven minutes during evening rush hour, an average speed of 53.2 MPH, which is hard to match on Chicago's congested expressways. Meanwhile, the poor Hoosier State navigates a slow, tortuous route through southern Chicagoland. It arrives at Indianapolis six hours and five minutes later, having completed its 196 mile run at an average 32.2 MPH - a speed easily beaten by any car or bus on largely rural Interstate 65. The Brookings report mentions the extra distance on the Hoosier State, but to understand the difference, one needs to consider the time - nearly four times as much.

Frequency

Empire Builder in Minot, North Dakota.
No long-distance train in Amtrak's schedule runs more than once each day. This makes service to some parts of the country very inconvenient, coming only in the wee hours of the morning. No wonder ridership is low and expenses high!
Lack of frequency also results in a disproportionate cost per passenger. Stations along routes with infrequent service cost almost as much to maintain as those with lots of trains. It is also more difficult for Amtrak to utilize train equipment fully when trains don't run as frequently - especially when they run only three times weekly.

Case in point: The Texas Eagle runs daily between Chicago and San Antonio Texas (thanks in large part to TEMPO), but the Sunset Limited runs only triweekly between New Orleans and Los Angeles. In San Antonio these trains meet; cars from the Eagle are exchanged with the Sunset to provide a Chicago to Los Angeles through service. In order to make this work, two Superliner coaches are left in San Antonio between Sunset runs. The result is equipment under-utilization, and when monetized against to the Eagle's performance, makes it look more inefficient than it really is.

Reliability

Long-distance trains as a group are less reliable than short-distance trains for an obvious reason: the further they travel, the more things can go wrong. The problems can be either Amtrak's or the host railroads' - or neither, like the weather. In order to plan for these problems, certain stations have long dwell-times ("schedule-padding"), causing travel time to take a hit.

Case in point: the Blue Water, running daily between Chicago and Port Huron, Michigan. Though it only runs 319 miles, Amtrak and the Michigan Association of Railroad Passengers have recently received many complaints that the train arrives at station after station and sits there waiting for 15 or 20 minutes. Why? Because in previous years the host railroad (CSX Transportation) had been working on tracks and otherwise slowing down the Blue Water, resulting in very unreliable schedules. Now that it's running on time nearly every day, CSX doesn't want to spoil its record of delivering the train to Chicago on time by shortening the schedule.

One long or many shorts?

One other way of analyzing long-distance trains was overlooked by the Brookings report. Yes, you can consider the California Zephyr as a single run from Chicago to Oakland/Emeryville, California. But as NARP and the Midwest High Speed Rail Association have pointed out more than once, you'll understand how they really function if you look at them as a large series of shorter connections. The Zephyr connects the Bay Area with Lake Tahoe, Reno with Salt Lake City, and Denver with Omaha. Not to mention connecting smaller towns, like Reno to Winnemucca, Helper Utah to Grand Junction Colorado, and McCook Nebraska to Ottumwa Iowa. In effect, each long-distance train is a whole series of trains that run less than 400 miles each. True: these smaller routes are not the large metros that generate so much of Amtrak's business. But the small communities are in many respects the "heart" of the United States, and are being abandoned by all the for-profit carriers, both air and highway.

And though these small towns and cities may not contribute much "fare-box" revenue, they are important to Amtrak's political survival - in fact, they are vital. Time after time, anti-Amtrak presidents have submitted zero-dollar Amtrak budgets to Congress. Time after time, senators and congressmen from both parties have saved Amtrak because of the small towns they represent. The TEMPO group is made up almost exclusively of citizens from small towns along the Texas Eagle's route. Why? Because they believe whole-heartedly that this one train is vital to their town's economic well-being.

Now what?

Despite its analytical oversights, the Brookings report makes a very important suggestion: involve the states in financing the long-distance trains that serve them. The report points out that with "skin in the game", states work harder to make sure they get quality rail service. One can hope that before too long, states with only "midnight service" will cooperate to get a second frequency along their line, providing daytime service for their residents. Remember: it doesn't cost twice as much to add a second frequency, because the stations and support facilities are already in place. (The real challenge is convincing the freight railroads to host them.)
The report says, "When states contribute to Amtrak operations, they have a vested interest in service quality". A couple of small examples:
  • Over the last six years, Illinois has allocated significant funds to provide two extra round-trips from Chicago on each of three routes served by Amtrak long-distance trains: to St. Louis (284 miles on the route of the Texas Eagle), to Carbondale (309 miles on the route of the City of New Orleans), and to Quincy (258 miles, mostly on the route of the California Zephyr), each taking about 5½ hours. In response to requests from Illinois riders, the state negotiated a special menu for the café on state-funded trains.
  • Wisconsin pays Amtrak to run the seven daily Hiawatha round-trips between Chicago and Milwaukee. According to Chicago Union Station staff, Wisconsin DOT is very sensitive to tardiness in getting Redcaps to the Hiawatha platform, and will insist to Amtrak management that service be provided promptly upon train arrival.
A larger example of the effectiveness of state investment of resources is the Midwest Regional Rail Initiative, formed in 2004. The eight states in this coalition agreed on region-wide primary routes and prioritized improvements to be made. Their cooperation landed them large sums of ARRA funding when that became available (though of course Wisconsin and Ohio suffered political setbacks at that time). The funding resulted - among other things - in a joint order (with California) for new railcars and locomotives, the upgrading of track speed in Illinois to 110 MPH between Chicago and St. Louis (in progress), and the state purchase and future upgrading - with federal assistance - of the line between Kalamazoo and Dearborn in Michigan.

So state involvement is a good thing, as the Brookings report points out. Given the lack of effectiveness currently evident in our national legislature, I have to disagree with NARP's press release, stating that long-distance trains should remain solely a federal resonsibility. We must certainly insist on continued federal support for long-distance service, but the states are probably the best level on which to advocate for better rail service - both for long-distance and corridor trains. Let's go for them both.
Amtrak California: state-supported San Joaquin at Bakersfield
To learn more:
* All links accessed 2013-03-16

Wednesday, February 27, 2013

Transit Elections: 2012 Success, 2013 Outlook

Hey folks - sorry for the long, dry spell at Wake Up, Washtenaw! I've been busy with several projects - still am... BUT I want to pass this along to you from the newsletter I got from the Center for Transportation Excellence (CFTE). It's a roundup of news about transit campaigns of 2012.


Last year was a big year for transit investment at the ballot box. Voters approved 79% of the 62 measures that appeared on ballots between March and December 2012. This was also the most transit measures in a single year since CFTE began monitoring in 2000.  With major wins from Michigan to Baton Rouge to the Carolinas, many local and regional transit projects moved forward with voter support.

Significant losses did occur in Los Angeles and Atlanta, reminding us that each campaign faces unique and often unexpected hurdles. The story out of Los Angeles was especially frustrating as the campaign garnered more than 65% of the vote yet lost because of the state's supermajority requirement.  The referendum in Atlanta received a lot of media attention, unfortunately leading many to ask if new financing for transportation is something that voters will support. However, with a long-term success rate of 72% (between 2000-2012), we know that voters are willing to support investment when the transportation and economic benefits are clear. 


Traditionally, off-cycle years have seen fewer ballot measures and 2013 appears to be no exception. Perrysburg, OH, and Kalamazoo County, MI, are each taking property tax measures to voters in May. Jackson County, MO, is considering placing a one cent sales tax for buses, trails, and commuter rail on the ballot in August. For many other communities, this year's campaign is to get legislative or local approval to go to voters in 2014 and 2015.

For more information on current and past ballot measures, visit www.cfte.org/elections

Friday, January 18, 2013

Infrastructure is the Key


Carlos Ghosn is not exactly a household name. For one thing, how to pronounce it? (Apparently one just ignores the h and the s and goes with "Gon". I'll refer to him as Carlos - most of us can handle that!) Carlos is the embodiment of successful international business. Head of the Renault-Nissan Alliance, uniting French and Japanese automotive giants, he was born in Brazil, completed secondary school in Lebanon, and earned his engineering degree in France. In 1996, after spending his earlier career in the tire industry, he joined Renault; three years later, after a corporate alliance was forged, he became head of both Renault and Nissan. This alliance (which Carlos stresses is not a merger) manufactures one tenth of all the automobiles in the world.
Co-Chair Carlos Ghosn captured during the World Economic Forum's India Economic Summit 2009 held in New Delhi, 8-10 November 2009. (This is a file from the Wikimedia Commons.
Tuesday evening (January 15) he took time off from the Detroit International Auto Show to speak at the University of Michigan School of Engineering. The house was packed in Stamps Auditorium, and a video link was sent to another nearby auditorium. Carlos, cutting a dapper figure in a grey silk suit, took only about 20 minutes to speak before turning the session into a lively Q&A. His major theme was the importance of research in the automotive industry, and the rapid changes he expects to see during the next decade.
But progress in the auto industry is not the focus of Wake Up Washtenaw. Of course, we applaud the emphasis Carlos and most other auto makers place on reducing or eliminating emissions and becoming less dependent on non-renewable energy. Increasing safety in driving, another research theme championed by Carlos, is certainly a laudable goal. But we remain concerned about several topics not addressed by even forward-thinking auto execs like Carlos: the sheer mass of vehicles and the space they demand on the planet in competition with people; the health problems caused by too much personal automobile use; the growing cost of transportation as a percentage of family income when autos are necessary for productive living.
So why blog about him? Here's what really jumped out at me: the importance Carlos attribures to infrastructure in the overall economy of a region. One of the students asked Carlos about "global gridlock" - the problem that arises all over the world when too many cars crowd too little road space. Here's what Carlos had to say: investment in infrastructure is key to growing a region's economy.
Of course, he was talking about automotive economy, but his conclusions are clearly applicable to economies as a whole. He drew a quick comparison between three countries: China, India, and Brazil. China and India are roughly equal in population, very different in culture. Brazil has much lower population and is blessed with abundant natural resources. Which of them should have the fastest-growing economy? Here's my transcript of the core of his statement:
Brazil is an extremely rich, rich country. Even with this, China has a much higher growth rate than India, and much higher growth rate than Brazil. It's really surprising! You say, well you know what? Brazil should grow more than China, because there is less population and there is a high density of leveraged [?] companies with a lot of resources, but still the growth rate of Brazil is lower than China. And if you try to analyze why, at the end of the day you come - and I'm not trying to make a kind of focal analysis of it - but I would say that the one fundamental factor is, the Chinese always and systematically have dedicated a lot of resources to their infrastructure, and they have been building infrastructure before people need the use of infrastructure. ...
And in fact, our own investments, when we have been studying to go to a country and how much we should invest in a country, always takes into consideration how much funds the country – how much attention the country is dedicating –  to developing infrastructure.
...frankly, nothing can replace the necessary investment in infrastructure, especially important in emerging markets.
All very well for emerging markets, but what has that got to do with Michigan? I'd say, a lot! We are struggling to emerge from a prolonged recession, but our income and education levels have declined rapidly over the last ten or twelve years. If we continue on this course, we'll find ourselves clearly in the category of what people politely call, "emerging economies". It's critical for us to listen to the advice of people with wide experience of how "the world" works. We must not take refuge in the mantra, "But We're Different!". Because we're not so different that the laws of business economics don't apply to us.
So when Gov. Snyder, in last night's "State of the State" address, urged the Legislature to provide revenue to improve our transportation infrastructure, he was talking business sense. Republicans may complain that he's just trying to levy a new tax, and "No New Taxes" has been their live-or-die motto for years. But "No New Taxes" = "No New Investments", and what business has ever succeeded with such a motto? On the other side of the aisle, the Democrats are complaining that the taxes are unfairly distributed, with the greatest burden on the middle class. But we must all share the burden - quibbling about who's shouldering the heaviest load gets us nowhere.
The sooner we all shoulder the responsibility for improving our infrastructure, the sooner we'll see more investment in Michigan by businesses of all kinds - because all kinds of businesses, as well as private citizens, benefit from robust, reliable, sustainable transportation infrastructure. What's more, investment in infrastructure is investment that largely stays in the state and in the region. It's an investment we profit from three times: first, when the money is spent in our region to do the work; second, when the improved infrastructure brings us better transportation options; and third when we attract greater investment from out of state.
What's to lose with that? So please, Republicans and Democrats, stop the quibbling and raise the revenue - fairly - for diverse transportation infrastructure!

Monday, October 15, 2012

Our Link to the West

Michigan's Department of Transportation is takng part in a study of the rail corridor that connects Michigan with the West: the stretch of track between Porter, Indiana, and Chicago. They have asked for public input as part of the Federal study of alternatives, and here's what I had to say:

I submit this comment as a concerned member of the traveling public, and as someone who would like Michigan to be a prosperous, well-connected state for my grandchildren and their generation.

Rapid, reliable passenger rail is a critical link in providing a sustainable future for coming generations, given the growing economic and environmental cost for air and highway travel. The Chicago-Porter segment is a vital part of Michigan's link not only to Chicago but to the entire West of the United States. And this is true not only for us in Michigan, but for Maryland, Virginia, Pennsylvania, New York, New England, and Indiana itself. Further, it is a key to making Michigan an active link with Ontario, Quebec, and the maritime provinces of Canada.

Given this critical role, the Chicago-Porter corridor study must include consideration of fully high-speed rail with speeds up to 220 MPH. Given today's economic realities, such speeds may not be practical in the immediate future. However, it is essential that the corridor's initial engineering studies be conducted with these higher speeds as the ultimate goal. Decisions which preclude 220 MPH speeds over most of the corridor must be excluded from the final alternatives. To include suboptimal alternatives would jeopardize Michigan's future position as a transportation leader, and seriously impede our grandchildren's access to a prosperous economic future.

You can submit a comment too - if you do it TODAY, October 15. Midwest High Speed Rail Association has provided a direct link to do that: Click here to submit your comment!

Wednesday, September 12, 2012

"Heritage TOD" in New Jersey


Back in July, I wrote about looking at transit-oriented development (TOD) in three phases: Heritage, Mature, and Young. today, I'd like to take a look at New Jersey's "heritage TOD", based primarily on a visit in March, this year.

One evening during my visit, I arranged to meet friends for dinner in Summit. I took an evening NJ Transit train from Penn Station, New York, where I happened to be that afternoon. This train travels on what NJ Transit calls the Morris & Essex Line, previously the Lackawanna. As the train stopped at station after station, I heard the ring of names made familiar by my mother: East Orange, Orange (where she had spent much of her childhood), South Orange, and Maplewood (where she was born). Her father (my grandfather) had lived in New Jersey and commuted daily to 635 Broadway in New York City. Gradually, the realization sank in that my grandfather must have ridden this same train back in Lackawanna days, past these same stations, day after day during the 1920s and 1930s - maybe longer. Looking out at the twilit towns I realized that almost all the buildings and stations were the same, too. After 80 years, that part of New Jersey had only added a few layers of grime to the bricks.

And I realized, "These towns are all transit-oriented development, heritage style!"
Aerial photo of "The Oranges" (Google Earth)
New Jersey has grown and developed a lot since that time, but the towns as seen from this rail line have remained largely unchanged. Much of the growth has been filling in areas that lay between towns, while the centers of many small cities have retained most their early twentieth century appearance. Now, Northeastern New Jersey is an almost solid tapestry of commerce, industry, and residences, as you can see this is the aerial map of "The Oranges" (click it for a larger version). Lighter gray areas are the commercial districts, and the dark green is forest reserves. The rest is all residential.

The Morris & Essex rail stations are shown with blue train symbols, and the line itself appears as a thin, dark line. It enters from the east (center right) and heads northwest toward the City of Orange; then it turns abruptly southwest to avoid a hill (dark green area). Beyond Maplewood, it swings west for a short distance before bending southward, leaving the photo area in the lower left corner. Notice how the commercial areas and the rail line are close together. Smaller commercial areas like Livingston (lower right) are found along roads where there is no rail service, but when this area grew up, the rail lines, rather than the roads, were the primary transportation arteries.

According the the Eire-Lackawanna Historical Society, the rail line we've been looking at opened from Newark to Orange in 1836, and westward to Morristown two years later, in an era when the alternative to rail travel was horse-and-buggy or horse-drawn omnibus. The line was electrified in 1930 in order to provide better commuter service, and it is powered by electricity today. (According to the Sierra Club, New Jersey has a strong clean-energy policy. About half of its electricity is generated by nuclear power, and it derives more energy from photo-voltaic sources than any state except California. Wind-power generating facilities were being built along the Atlantic coast as of mid-2011 - see the report linked below.)

Main Street, Orange, New Jersey (Google Streetview)
Not all the stations are surrounded by commercial or mixed-use districts: beyond the City of Orange, some of the stations are in residential neighborhoods. Buildings in the commercial station areas of the Oranges appear to be two- and three-story mixed use structures, with the traditional shops on the ground floor and apparently apartments above. They are very much like Michigan towns built around the same era - the late 19th and early 20th centuries. That mixed-use pattern, commercial with residential in the same building, is the use now recommended by most urban planners.

In the area of Brick Church Station, there appears to be some newer transit-oriented development as well.
One block north of Brick Church Station, Orange, NJ

Even with the many transit lines available, the population density is such that highways are overcrowded, while NJ Transit has been purchasing double-deck rail cars and more powerful locomotives to pull more of them. Trains serving Orange run from 5:05 AM to 1:48 AM the next day on weekdays with a total of 102 trains. On weekends service is also good, with 40 trains running between 5:18 AM and 1:48 AM the next day. About half of these run to and from Hoboken, a growing center of employment now, while the other half serve New York Penn Station. In the other direction, the line splits west of the Summit station, where some trains terminate; others travel southwest to Gladstone (population 2,582), while the remainder travel northwest to Dover (population 18,157) and a small number continue to Hacketstown (population 9,724).
The Raritan line, originally the Central Railroad of New Jersey ("Jersey Central"), shows an even clearer pattern of development along the line. In this next picture, you can easily guess where the railway runs, even without the stations marked.
Where's the Raritan Line? (Google Earth)

The aerial photo below is the same, but with stations marked.
Raritan Line with stations marked (Google Earth)

Did you guess right? (The other stations on the right-hand side of the picture are on the Northeast Corridor, running almost straight northeast-southwest, and the New Jersey Shoreline (originally New York and Long Branch) which leaves the NEC and runs south parallel to the Atlantic coast.

My mother's brother, like his father, lived in New Jersey and worked some days of the week in New York City. (He was a writer and editor, and was able to work at home the other days of the week.) He originally lived in Westfield, later moving a little north to a more suburban, wooded area in Mountainside. His wife drove him to the station in Westfield when he needed to go in to the city.

The town of Westfield (population 30,316) shows a very transit-oriented design from the air:
Westfield, NJ - Raritan Line detail (Google Earth)

The commercial area, north of the station, is clustered around it with the clear implication that many Westfield citizens' commute began and ended with a trip to the station. Industrial and commercial buildings are stretched along the railway line, no doubt confined there by zoning ordinances.


Westfield NJ, Jersey Central Depot (1892)
What is now downtown Westfield was first settled in 1720; the railroad line from the coast reached it about 1840. The Jersey Central built the Westfield station in 1892. The settlement's population grew, and the area was incorporated first as a Township, and finally in 1903 as a Town. But of course the mid-twentieth century saw the rise and dominance of the automobile, and with it a change in development and ridership patterns. This table shows ridership in selected years on the Jersey Central:
Jersey Central revenue passenger traffic, in millions of passenger-miles.
Year Traffic
1925 480
1933 337
1944 480
1960 175
1970 124
Source:ICC annual reports

Ridership on all Jersey Central's lines peaked in 1925, and probably would have continued falling had not World War II, with its fuel rationing and cessation of automobile production intervened to force people back onto trains. Now, with NJ Transit investing more in rail service, the ridership has climbed again: it was up to 1,007,035 on the Raritan Valley in 2005. (I can't find more recent figures, and can't convert what I've found to passenger-miles, so I can't really compare current ridership with the past.)


In many ways, northern New Jersey's early twentieth century development patterns are a model for newer TOD. The clusters of higher density around stations seen in the Oranges and Westfield are being emulated in contemporary TOD plans. The streets then were laid out primarily in a grid pattern, which traffic engineers now tell us is more effective than the meandering roads and culs-de-sac favored in late twentieth-century developments. But as in Northeastern New Jersey, there are not one but many patterns of successful TOD. One size did not fit all as that region developed, nor does one plan work in all regions now. Planning TOD remains a challenging, evolving science, with a great deal of art and local wisdom mixed in. But we're fortunate to be able to see how it was done a century and more ago.